30-Year Tornado Data Shows 70–80% Annual Probability Across Ohio’s Miami Valley, With Even Higher Odds in Central Indiana
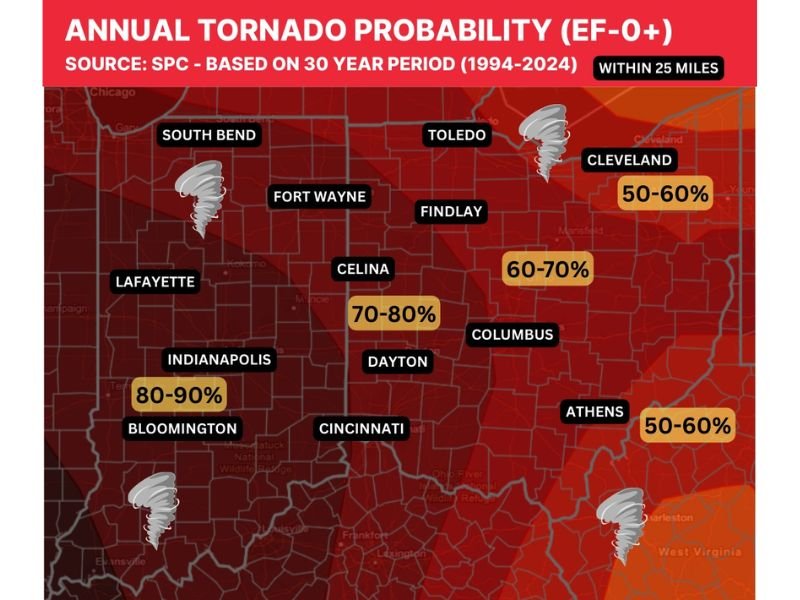
OHIO — As the region approaches its traditional spring severe weather uptick, newly highlighted 30-year data is putting tornado risk across the Miami Valley and neighboring Indiana into clearer perspective. The latest probability map, based on Storm Prediction Center data from 1994–2024, shows that much of western Ohio faces a 70–80% annual chance of a tornado occurring within 25 miles of a given location.
This does not mean every town sees a tornado every year — but statistically, somewhere within a 25-mile radius, one is likely to occur during a calendar year.
Miami Valley Shows Elevated Annual Tornado Odds
The map highlights western and central Ohio as one of the more active tornado corridors in the state.
Cities including:
- Dayton
- Celina
- Findlay
- Columbus
fall within zones showing 60–80% annual probability, depending on location.
The highest concentration within Ohio appears across the Miami Valley region, where Dayton and nearby communities sit squarely in the 70–80% range.
Farther northeast, cities such as Cleveland and southeastern communities like Athens show slightly lower probabilities, generally 50–60% annually, though that still represents a meaningful risk.
Central Indiana Shows Even Higher Probability
Just west of Ohio, central Indiana displays even more striking numbers.
The map shows:
- Indianapolis: 80–90% annual probability
- Bloomington: Within the higher-risk corridor
- Fort Wayne and Lafayette: Elevated annual odds
This suggests that central Indiana remains one of the more consistently active tornado regions in the broader Midwest when measured over long-term data.
Understanding What the Probability Actually Means
It’s important to clarify what this data represents.
The probability reflects the chance of a tornado of any strength (EF-0 or higher) occurring within 25 miles during a given year, based on a 30-year dataset.
It does not indicate:
- How strong a tornado would be
- How damaging it would become
- Whether it would directly impact a specific neighborhood
Residents may still go years without personally experiencing a tornado warning, even in high-probability zones.
The map strictly reflects historical frequency within a set radius — not guaranteed impacts.
Long-Term Trends and Increased Detection
Meteorologists have noted that Ohio’s annual tornado count has trended upward over time. Some of that increase can be attributed to improved radar technology and more comprehensive reporting.
However, long-term trends also suggest an increase in thunderstorm days in some parts of the Midwest, which naturally raises opportunities for tornadic development.
As spring approaches, the data serves as a reminder that the Miami Valley and central Indiana sit within an active severe weather corridor — even if it doesn’t always feel like traditional “Tornado Alley.”
Preparation remains key: having multiple ways to receive warnings, reviewing safety plans, and staying weather-aware during outbreak days can make all the difference. For continued severe weather updates, data breakdowns, and regional weather coverage, stay connected with CabarrusWeekly.com.