April 27, 2011 Super Outbreak: How Day 1 Tornado Probability Maps Covered Mississippi, Alabama, Georgia and Tennessee Under Old vs New SPC Format
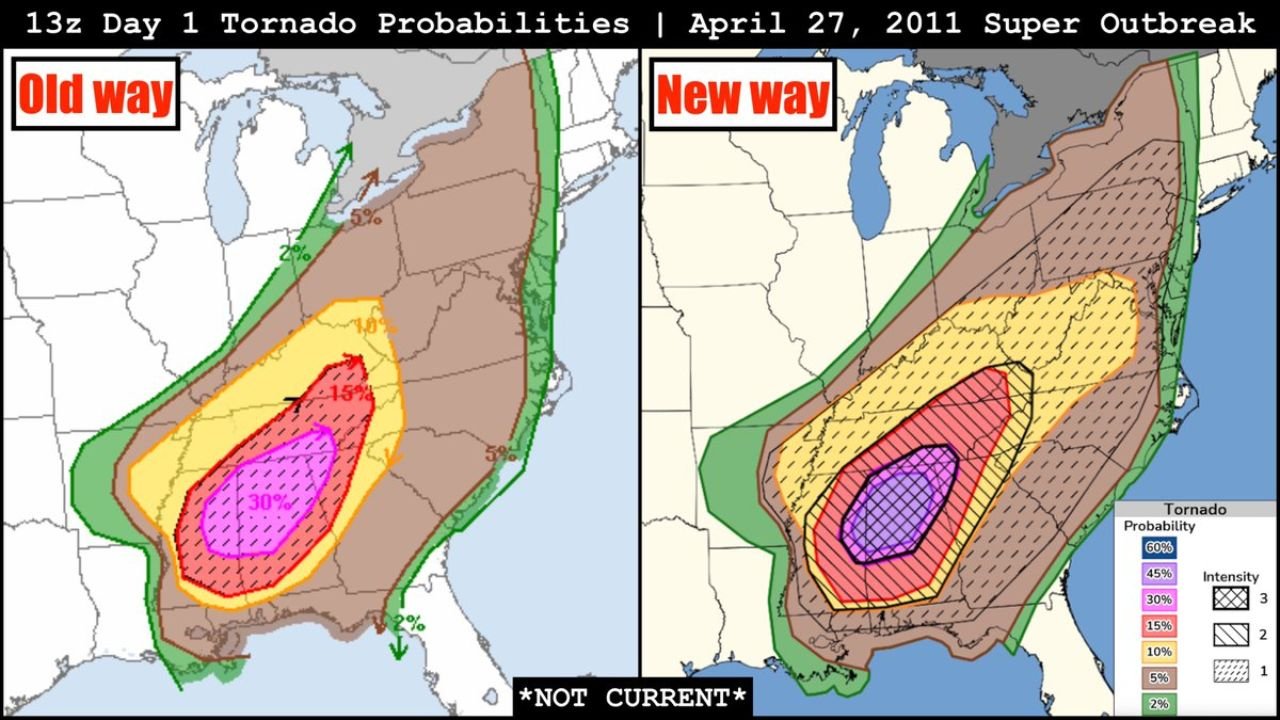
UNITED STATES — The April 27, 2011 Super Outbreak remains one of the most significant tornado events in modern U.S. history, and comparing Day 1 tornado probability maps from that day highlights how forecast communication has evolved.
The side-by-side comparison of the “Old Way” and “New Way” formats shows how risk areas across the Deep South and Mid-South were depicted during the historic outbreak.
Geographic Focus: Deep South and Tennessee Valley
Both map versions show the highest tornado probabilities centered over:
• Mississippi
• Alabama
• Western and central Georgia
• Southern and middle Tennessee
The core of the outbreak stretched from central Mississippi through northern Alabama and into southern Tennessee, with the risk area extending northeastward into Georgia and the southern Appalachian region.
Lower but still notable probabilities extended into portions of:
• Arkansas
• Kentucky
• The Florida Panhandle
• The Carolinas
“Old Way” Probability Depiction
In the older format, tornado probabilities were displayed with contour shading indicating percentage risk.
The highest highlighted area showed 30% tornado probability, centered primarily across central Mississippi and central Alabama. Surrounding rings indicated 15% and 10% probabilities, covering a broader region of the Southeast.
Even outer zones of 5% and 2% probabilities extended from the Gulf Coast northward into the Ohio Valley and eastward into parts of the Carolinas.
The layout emphasized numeric percentages but did not visually distinguish the intensity potential as clearly as modern graphics.
“New Way” Probability and Intensity Overlay
The updated format introduced more structured shading and hatch marks to represent enhanced risk of stronger tornadoes.
In the new depiction, a central purple-shaded area over Mississippi and Alabama represented the highest tornado probability zone. Hatched overlays signified the potential for significant tornado intensity within that core area.
Surrounding layers of red, orange, and yellow extended the risk outward across Georgia, Tennessee, Kentucky, and into the southern Appalachian region.
This revised presentation provided a clearer visual emphasis on both probability and intensity threat within the same map.
How the Risk Envelope Expanded Across the Southeast
Both formats show a long, southwest-to-northeast risk axis running from the central Gulf Coast into the Mid-South.
States heavily encompassed within elevated probabilities included:
• Mississippi and Alabama at the core
• Georgia and Tennessee within higher-tier zones
• Arkansas and Kentucky in surrounding risk areas
The risk corridor reflected the classic severe weather alignment of strong instability, deep-layer wind shear, and a powerful storm system tracking through the region.
Communication Evolution, Not Risk Difference
It is important to note that the comparison reflects a change in how probabilities were communicated — not a change in the magnitude of the event itself.
The April 27, 2011 outbreak produced widespread, violent tornadoes across the Deep South and Tennessee Valley. The updated map style simply provides a more intuitive visual structure for conveying high-end tornado potential.
Bottom Line
The April 27, 2011 Super Outbreak probability maps show how Mississippi, Alabama, Georgia, and Tennessee were placed under some of the highest tornado risk categories available at the time. Comparing the old and new formats highlights the evolution of forecast communication, with the newer style offering clearer visual emphasis on both probability and intensity.
While this example is historical and not current, it underscores how high-impact severe weather days are conveyed to the public.
For continued weather analysis and educational breakdowns, visit CabarrusWeekly.com.