December 11, 2021 Timeline Reexamined in Kentucky as Bremen Radar Data Reveals Corrected Tornado Intensity and Velocity Peaks
KENTUCKY — A deeper reanalysis of radar data from the devastating December 11, 2021 tornado event is shedding new light on what actually occurred near Bremen, Earlington, and Cayce, correcting earlier extreme velocity readings and refining our understanding of the storm’s true intensity.
This updated breakdown focuses on velocity (VRot) measurements captured by multiple radar sites, offering a clearer and more accurate picture of the tornado’s strength during its most violent phase.
Initial 134 kt Reading Now Considered Erroneous
Early reports suggested a peak rotational velocity (VRot) of 134.1 knots near Bremen, Kentucky—an extremely high value that would indicate an exceptionally intense tornado.
However, further analysis determined that:
- This reading was likely incorrect
- The error likely stemmed from radar dealiasing issues, particularly within GR2Analyst data
Dealiasing errors can occur when radar struggles to correctly interpret very fast-moving winds, sometimes producing inflated or misleading velocity values.
Reanalysis Using Multiple Radar Sources Provides Clarity
A more detailed review using QuadWeather analysis and multiple radar sites—specifically KPAH (Paducah) and KHPX (Fort Campbell)—helped refine the actual peak velocity values.
The corrected findings show:
- KPAH radar:
- Peak VRot of 102.5 knots at 02:59:23Z
- Located southwest of Cayce, Kentucky
- Corresponds to approximately EF2-level intensity
- KHPX radar:
- Peak VRot of 108.8 knots at 04:42:41Z
- Located southwest of Earlington, Kentucky
- Corresponds to approximately EF3-level intensity
These values provide a more realistic and scientifically supported estimate of the tornado’s strength during key moments.
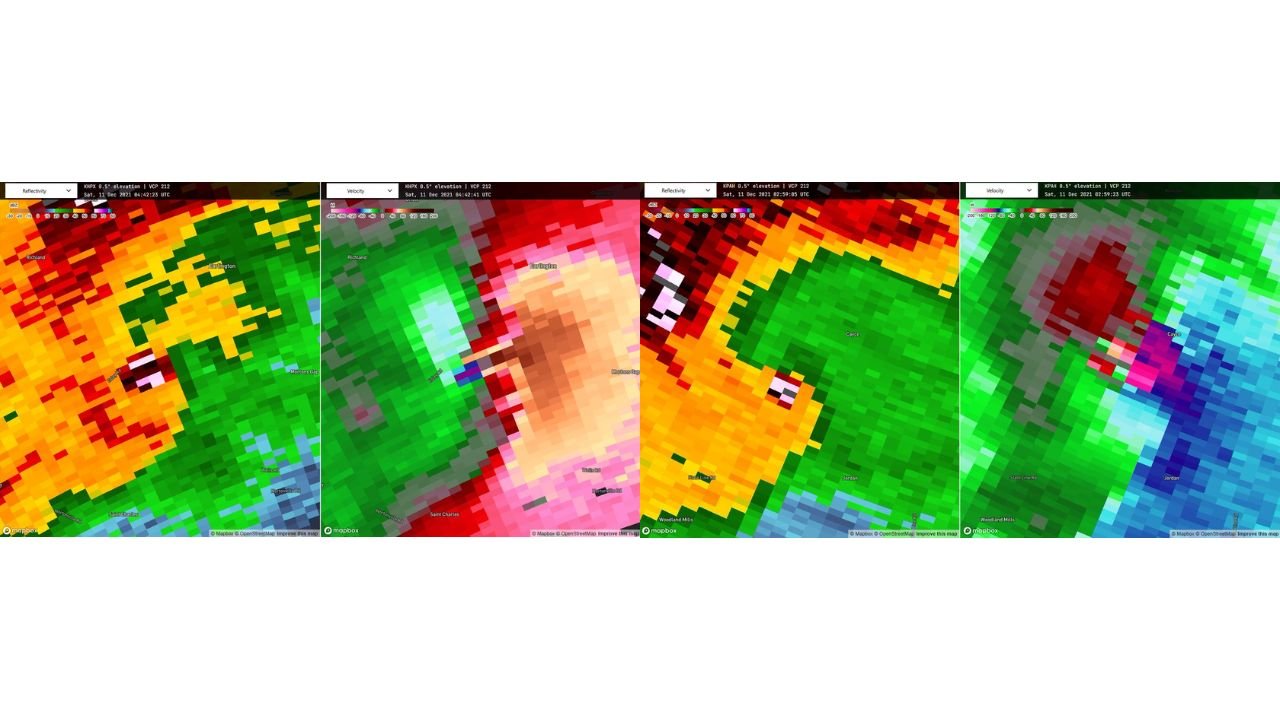
What the Radar Imagery Shows
The radar imagery highlights two critical components:
- Reflectivity scans (left panels):
Show the structure of the storm, including heavy precipitation cores and potential debris signatures - Velocity scans (right panels):
Reveal intense areas of rotation, with clear inbound and outbound wind signatures indicating strong circulation
The combination of these scans confirms the presence of a well-organized and dangerous tornado, even without the previously reported extreme velocity.
Why Accurate VRot Data Matters
Understanding true rotational velocity is essential because it helps meteorologists:
- Estimate tornado intensity in real time
- Improve warning accuracy
- Conduct reliable post-event damage assessments
Overestimated values can lead to confusion, while corrected data ensures better forecasting and historical documentation.
A More Accurate Picture of the Bremen Tornado
While the corrected values are lower than initially reported, they still confirm a significant and destructive tornado event, capable of producing severe damage across western Kentucky.
The storm’s intensity—reaching EF2 to EF3 equivalent levels based on radar velocity—aligns more closely with observed impacts on the ground.
Continuing to Learn From Past Severe Weather Events
This reanalysis highlights how meteorology continues to evolve, especially with:
- Improved radar interpretation techniques
- Cross-verification between multiple radar sources
- Advanced post-event analysis tools
Each updated finding helps refine how future storms are detected, measured, and communicated to the public.
Stay Updated With Cabarrus Weekly
For more in-depth storm analysis, radar breakdowns, and severe weather insights from across the United States, stay connected with Cabarrus Weekly—your trusted source for clear, data-driven weather reporting.