Lake Erie Nears Rare Full Freeze as US Ice Map Shows 96% Ice Cover and Great Lakes Locking Up Fast
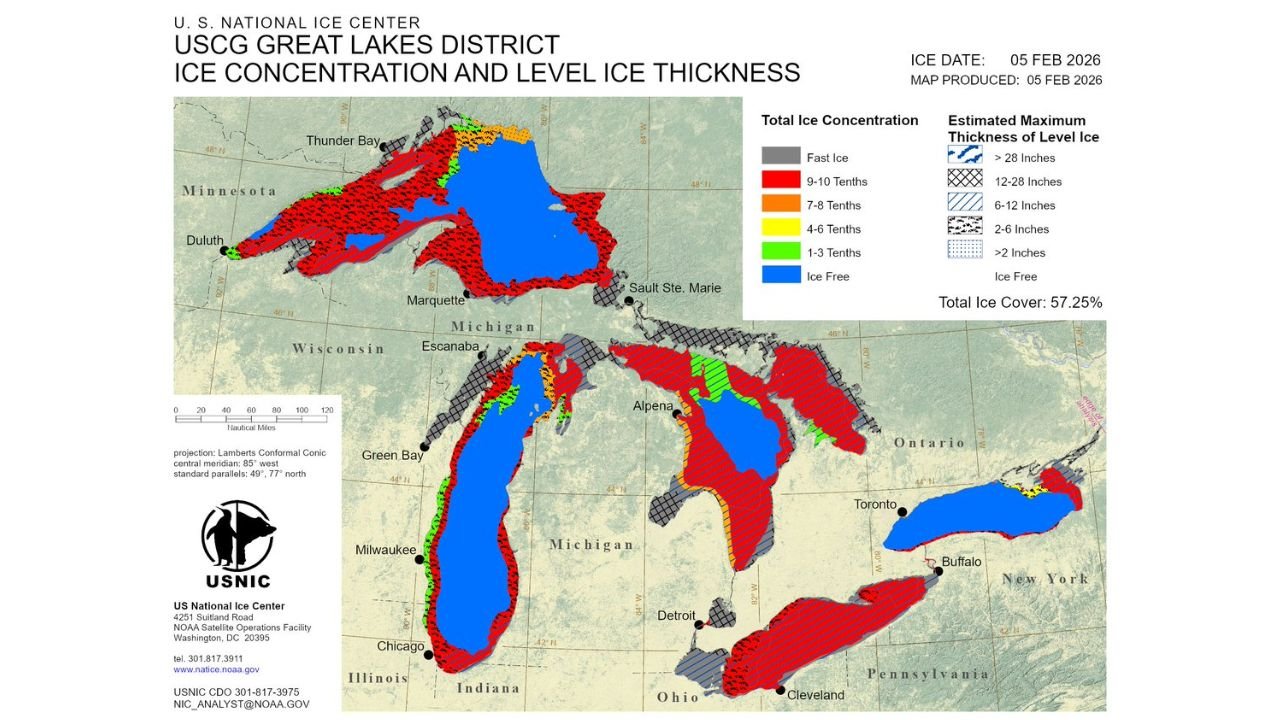
UNITED STATES — Lake Erie is now 96% ice-covered, and the latest Great Lakes ice analysis suggests the lake could reach 100% coverage within a few days—a threshold that, according to the note shared with the map, has not happened in 30 years. The new chart from the U.S. National Ice Center and USCG Great Lakes District also shows overall Great Lakes ice increasing, with the map listing Total Ice Cover: 57.25% on an ice-date stamp of Feb. 5, 2026.
What the Latest Great Lakes Ice Map Shows
The provided graphic is labeled “Ice Concentration and Level Ice Thickness”, produced on 05 Feb 2026, and it visually lays out where the lakes are frozen solid versus where open water still exists.
One of the biggest takeaways is how much of the ice is concentrated near shorelines and connecting waterways, while the deepest central portions of some lakes still show open water. The map also makes it clear that ice coverage is not uniform—some areas are close to fully locked in while others remain largely ice-free.
Lake Erie Stands Out: 96% Ice-Covered and Still Rising
Even on a day where multiple Great Lakes show extensive ice, Lake Erie is the headliner. The note attached to the image emphasizes two points that make this moment stand out:
- Lake Erie is currently 96% ice-covered
- It may reach 100% soon, a milestone that “has not happened in 30 years”
On the map itself, Lake Erie (near the labeled cities Cleveland and Buffalo) is shown with heavy ice coverage along broad stretches, with only limited areas indicated as ice-free.
Because Lake Erie is the shallowest of the Great Lakes, it typically freezes more readily than the others—so seeing it push toward a full freeze is a strong sign of sustained cold and repeated Arctic intrusions.
How to Read the Ice Concentration Colors
The legend shows ice concentration in “tenths,” which is commonly used in ice analysis:
- Fast ice (shown in a gray/hatched style on the map) indicates ice that is attached to the shoreline and does not move with winds and currents like free-floating ice.
- 9–10 tenths (red) suggests near-solid ice coverage.
- 7–8 tenths (orange) still represents significant ice.
- 4–6 tenths (yellow) indicates partial coverage.
- 1–3 tenths (green) means patchy ice.
- Ice free (blue) marks open water.
On the map, red zones ring many shorelines and bays, indicating widespread high-concentration ice near coasts—even where the central lake basins still show blue open water.
Ice Thickness: Where the Cold Is Building the Strongest “Level Ice”
The second legend focuses on Estimated Maximum Thickness of Level Ice, which matters because thicker ice increases hazards and changes how the lakes behave (including wave action and lake-effect processes).
The thickness categories shown include:
- > 28 inches
- 12–28 inches
- 6–12 inches
- 2–6 inches
- > 2 inches
- Ice free
While the map is a high-level overview, it strongly suggests that some shoreline zones are not just icing over—they’re developing meaningful thickness, especially in the coldest, most protected areas and bays.
Where Ice Is Concentrated Across the Great Lakes Region
The map labels several major reference points—Chicago, Milwaukee, Green Bay, Detroit, Cleveland, Buffalo, Toronto, as well as northern markers like Thunder Bay, Duluth, Marquette, Sault Ste. Marie, Alpena, Escanaba—and you can see the ice pattern shaping up differently on each lake:
- Lake Superior shows large open-water sections in the center, but heavy ice (high concentration colors) around significant portions of the lake perimeter.
- Lake Michigan appears mostly ice-free in the main basin, but with concentrated ice hugging the shorelines and near the northern sections and bays.
- Lake Huron shows large sections of high-concentration ice and fast ice in multiple areas, with open water still present in parts of the main basin.
- Lake Erie is the standout for near-total coverage.
- Lake Ontario appears largely ice-free in the central lake, with more ice along portions of the shoreline.
The combined “Total Ice Cover: 57.25%” is a big number when you remember it represents the entire Great Lakes system—not just one lake.
Why This Matters Beyond the Great Lakes
Even if you live far from the lakes—including communities here in North Carolina—this type of Great Lakes freeze is often a signal that the broader pattern has favored persistent cold air delivery into the eastern half of the country.
When the Great Lakes lock up like this:
- It’s a clear marker of long-duration cold across the region
- It can influence the way moisture and wind interact over the lakes (which can affect lake-effect snow behavior in the Great Lakes states)
- It can coincide with a more active winter pattern that keeps temperature swings sharper across the East
What to Watch Next
The biggest question is whether Lake Erie completes the final climb from 96% to 100% ice cover—and how long that level holds. The note in the image suggests we’re close to a historically rare moment, and the broader Great Lakes ice map supports the idea that winter is firmly in control across the region right now.
If you want us to cover more “big pattern” winter signals like this—major freezes, snowpack trends, and Arctic air tracking—keep following CabarrusWeekly.com and share what kind of winter you’re seeing where you live.