Massachusetts, Rhode Island and Connecticut Snow Bands Could Swing 1–8 Inches as GFS Shifts the Coastal Trough Just 20 Miles East
UNITED STATES — A new 00z GFS snowfall projection is highlighting just how tight the “margin of error” is for the next New England snow setup, placing the key trough axis about 20 miles east of most other guidance—a shift small enough to look trivial on a national map, but big enough to change who ends up under the heaviest snow band across Massachusetts, Rhode Island, and Connecticut.
What the GFS Map Is Showing (And Why 20 Miles Matters)
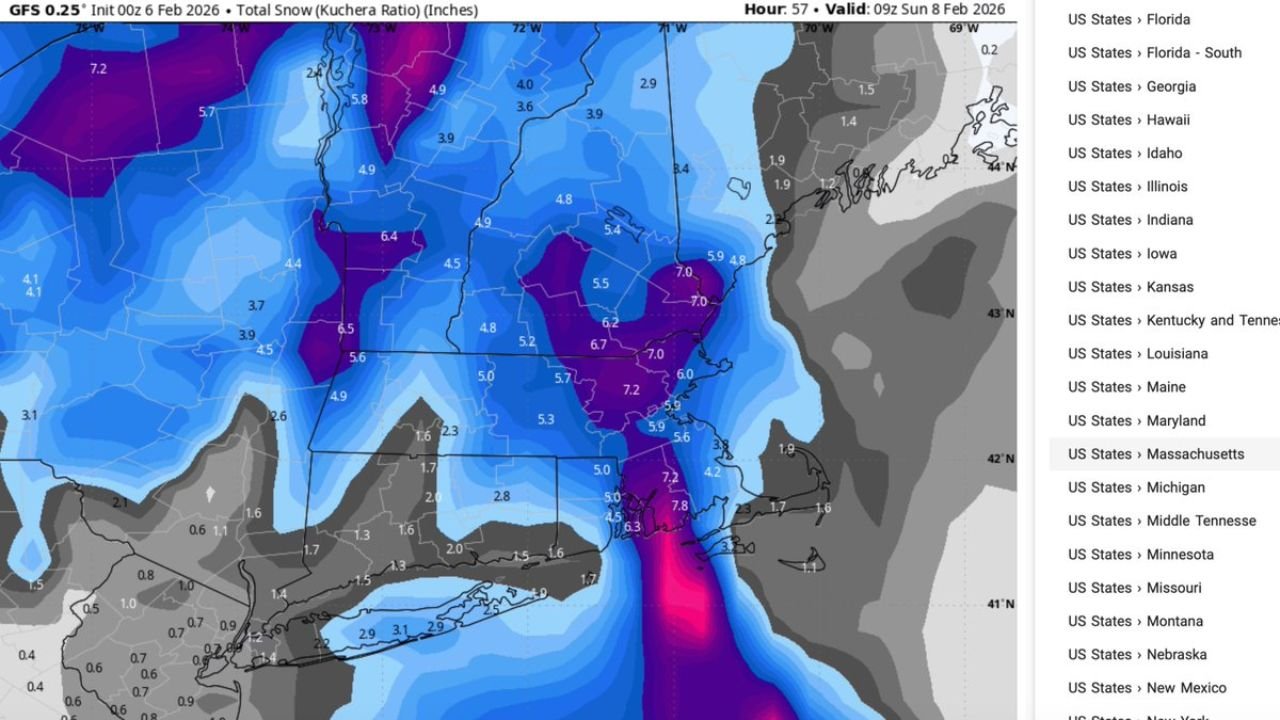
The model graphic is a GFS 0.25° Total Snow (Kuchera Ratio) view valid 09z Sunday, Feb. 8, 2026, and it paints a classic banding setup along and near the Southern New England coast.
When the trough sets up slightly farther east, it often pulls the most intense forcing closer to the immediate coastline and offshore waters. That can mean:
- Higher totals hugging coastal Massachusetts and Rhode Island
- Lower totals just inland, especially if dry air or subsidence wins out west of the band
- A very sharp “cutoff” zone where two neighboring towns can land in totally different outcomes
In other words, this is the kind of forecast where the difference between “a quick 2 inches” and “a disruptive 6 inches” can literally be a small wobble in the band.
Where the Heaviest Snow Signal Is Concentrated
On the GFS map, the strongest snow colors (deeper purples/pinks) are focused near and east of southern New England, with a particularly notable max signal close to the coastal waters south and east of Massachusetts and Rhode Island.
The map also shows several 4–7 inch pockets across interior parts of Southern New England, with numbers frequently clustering around 5–7 inches in and around the region north of Long Island and into parts of Massachusetts/Connecticut. That’s a hallmark of banded snow—moderate totals spread out, but a few “bullseyes” trying to jump higher.
What This Could Mean for Massachusetts
Massachusetts appears to be one of the states most sensitive to the band placement.
If the trough is indeed a bit farther east (as shown here), the risk increases for:
- A narrower, more intense band closer to the coast
- Bigger totals favored in eastern Massachusetts, with the potential for a quick ramp-up in snowfall rates
If the trough ends up sliding back west toward the consensus, the heavier band could shift inland enough to raise totals in interior communities while lowering totals right along the shore. Either way, the state is positioned near the zone where the gradient could be steep.
Rhode Island and Coastal Connecticut: Boom-or-Bust Potential
Rhode Island and coastal Connecticut often sit in the “sweet spot” for these setups when the band is aligned just right.
This GFS depiction suggests the region could see:
- A widespread plowable snowfall signal in the broader area
- A chance at higher, localized totals if the band locks in for a few hours overnight
But the same 20-mile issue applies here too: if the trough is a touch east, the jackpot band can lean toward the immediate coast and offshore… and if it’s a touch west, the heavier stripe can cut farther inland.
Why Snowfall Gradients Could Be Extremely Sharp
Banded snow works differently than a classic, evenly spread storm. Instead of “everyone gets 4 inches,” you get:
- A narrow corridor of heavier snow where lift is strongest
- Lighter snow just outside that corridor
- A rapid drop-off on the dry side of the band
That’s why meteorologists pay so much attention to trough placement and low-level wind direction in these events. The GFS message here is basically: the band is real, but the exact landing spot is still fragile.
What to Watch Over the Next Updates
If you’re tracking this for travel or weekend planning in MA/RI/CT, these are the practical things that matter most:
- Where the band sets up after midnight: the highest totals usually come from 2–4 hours of persistent heavy snow, not from steady light snow all day
- Whether the coastal front tightens: a stronger coastal boundary can enhance snowfall rates quickly
- How fast the band pivots: a slow-moving band can double totals in a small area
For now, the signal supports meaningful snow somewhere in Southern New England, but the exact “who gets what” likely won’t be nailed down until the band begins forming and radar trends confirm where it’s trying to lock in.
If you’re in Massachusetts, Rhode Island, or Connecticut, are you seeing the snow set up closer to the coast—or pushing farther inland than expected? Share what you’re getting where you are, and keep following CabarrusWeekly.com for more forecast breakdowns and impact-focused updates.