North Carolina and Virginia Show Up in a “Fantasy-Range” GFS Snow Bullseye, Hinting at a Rare Deep-South Winter Storm Signal
UNITED STATES — A viral, long-range GFS 384-hour snowfall map is making the rounds because it shows an eye-popping snow “bullseye” centered over North Carolina and Virginia, with the model depicting widespread heavy totals across the Carolinas and into the Mid-Atlantic. The post itself jokes that it would take “metaphysics for the GFS to actually be correct,” which is another way of saying: this is extreme-range guidance that should be treated as a signal—not a literal snowfall forecast.
What This Map Actually Is
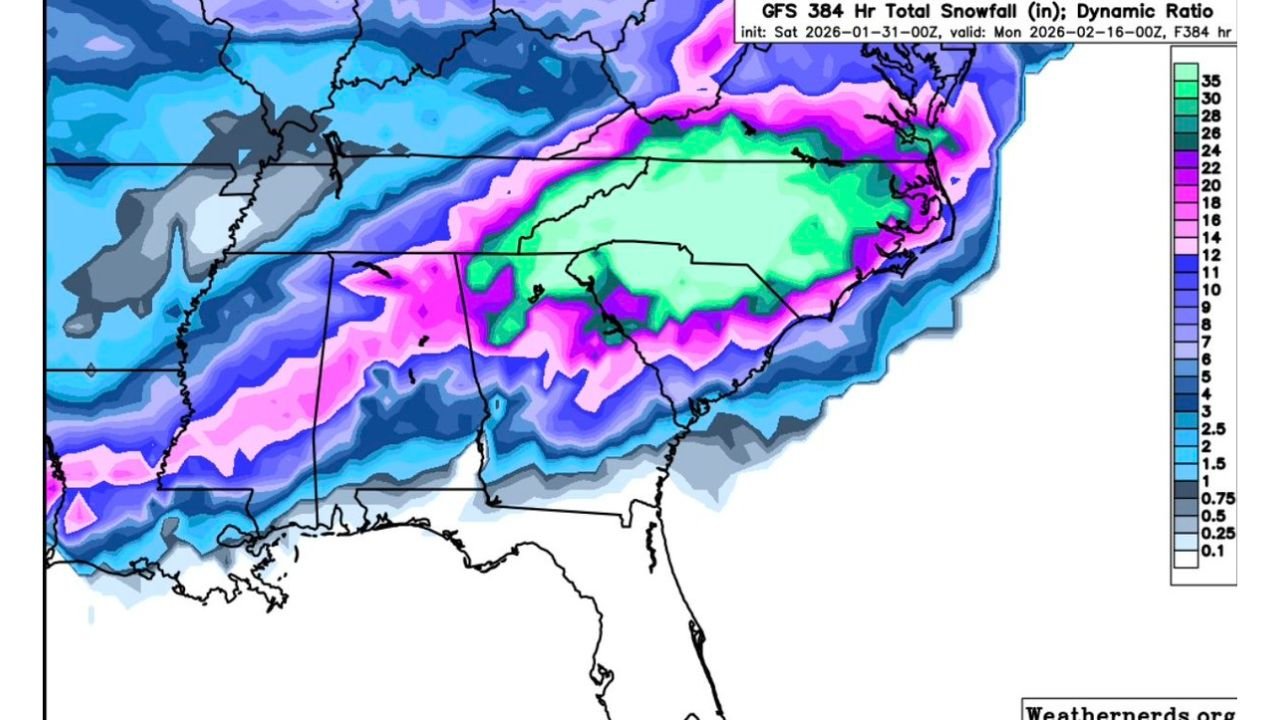
The graphic is labeled “GFS 384 Hr Total Snowfall (in): Dynamic Ratio”, initialized Saturday, 2026-01-31 (00z) and valid Monday, 2026-02-16 (00z). In plain language, that’s a projection more than two weeks out—a time range where the model can still be useful for spotting big-picture pattern ideas (cold vs. warm, stormy vs. quiet), but is not reliable for pinpointing storm tracks or exact totals.
That’s why this is being framed online as a “multiverse” scenario. The detail level on the map (exact placement of the heaviest snow ribbon) is the part that tends to shift dramatically from run to run at this lead time.
What the GFS Is Depicting Across the Southeast and Mid-Atlantic
Even with all the caveats, the map’s message is clear: it’s painting a scenario where a major winter storm could impact a huge chunk of the Southeast and Mid-Atlantic, with the most intense totals centered inland.
Here’s what stands out visually on the snowfall shading:
- North Carolina and Virginia: The brightest “core” shading is draped across the interior, suggesting very high totals in a wide area. On the legend, those colors correspond to major storm territory (the kind of totals you’d only see with a high-end event).
- South Carolina into Georgia and Alabama: The map spreads meaningful snow south and west of the core, implying an unusually expansive cold/snow footprint for the Deep South.
- Maryland, Delaware, and the Washington, D.C. area into southern Pennsylvania: A broad swath of moderate-to-heavy snow shading extends into the Mid-Atlantic, suggesting impacts wouldn’t be confined to one state.
- Tennessee and Kentucky: Snow shading reaches back into the Tennessee Valley and the southern Appalachians, indicating this isn’t a “coastal-only” look.
In short: the run is depicting a storm that would be “big” not just because of totals, but because of how far south and how wide the snow shield spreads.
What This Could Mean for North Carolina, Including the Cabarrus County Area
For Cabarrus County readers (Concord, Kannapolis, Harrisburg, Mount Pleasant, Midland), the reason this map grabs attention is that it places much of central North Carolina inside the heavier shading.
If a real storm ever verified even a fraction of what’s shown in the core, the impacts would be immediate and serious for our region:
- Road travel: I-85 and major connectors could become hazardous quickly.
- Power risk: Heavy snow and wind can bring down limbs—especially if any mixing occurs.
- School and business disruptions: A wide-area event typically triggers closures well beyond the immediate snow maximum.
But the key point is this: at 384 hours, the “where” and “how much” are the least trustworthy parts of the image. The more useful takeaway is that the model is at least flirting with a pattern that could support a winter storm in the eastern U.S.
Why This Is Not a Forecast
It’s tempting to see the colors and assume the outcome is locked in, but at this range:
- A storm track can shift hundreds of miles over multiple runs
- The cold air supply can weaken or strengthen significantly
- What shows as snow now could later become rain, mixed precip, or nothing at all
- A single “big hit” run often disappears on the next update
That’s why meteorologists treat these maps as pattern flags, not predictions. If future runs keep showing a stormy signal (even if the bullseye moves), then confidence in “something worth watching” can increase. If the signal vanishes, it was noise.
What Would Need to Happen for a Real Southeast Snowstorm
For North Carolina, South Carolina, and Virginia to see a true high-impact snow event, you typically need a few ingredients to align at the same time:
- Cold air in place (or arriving fast)
- A strong storm system tracking in a favorable corridor
- Enough moisture and lift to generate heavy precip
- The rain/snow line staying south and east of the Piedmont long enough
This GFS depiction is essentially saying, “What if everything aligns perfectly?”—which is why it’s being treated like a “multiverse” outcome online.
What Cabarrus County Residents Should Watch Next
If you’re in North Carolina and this kind of map pops up in your feed, the smart move isn’t to fixate on a number. Instead, watch for the more meaningful trend over the next several days:
- Do multiple model runs keep hinting at a stormy window in mid-February?
- Does the cold pattern hold in the East?
- Do shorter-range models begin to pick up a real system inside 5–7 days?
If the answer becomes “yes” across multiple updates, then it’s time to start taking specifics more seriously.
CabarrusWeekly.com will keep watching the pattern and translating the hype into what actually matters for North Carolina. If you’re seeing these snow maps shared locally, tell us what you’re hearing—and whether you want a dedicated Cabarrus County winter-storm tracker when the next real threat gets inside a reliable time window.