Viral Early-March Severe Weather Map Dramatically Shifts in 24 Hours, Highlighting Forecast Uncertainty from Southern Plains to Ohio Valley
UNITED STATES — A widely shared long-range severe weather map suggesting a major early-March outbreak across the Southern Plains into the Ohio Valley has changed dramatically in just one model cycle, underscoring the volatility of extended-range guidance.
The comparison highlights how quickly long-range projections can shift — and why caution is essential when interpreting viral weather graphics.
Viral Plot Showed Widespread Severe Signal
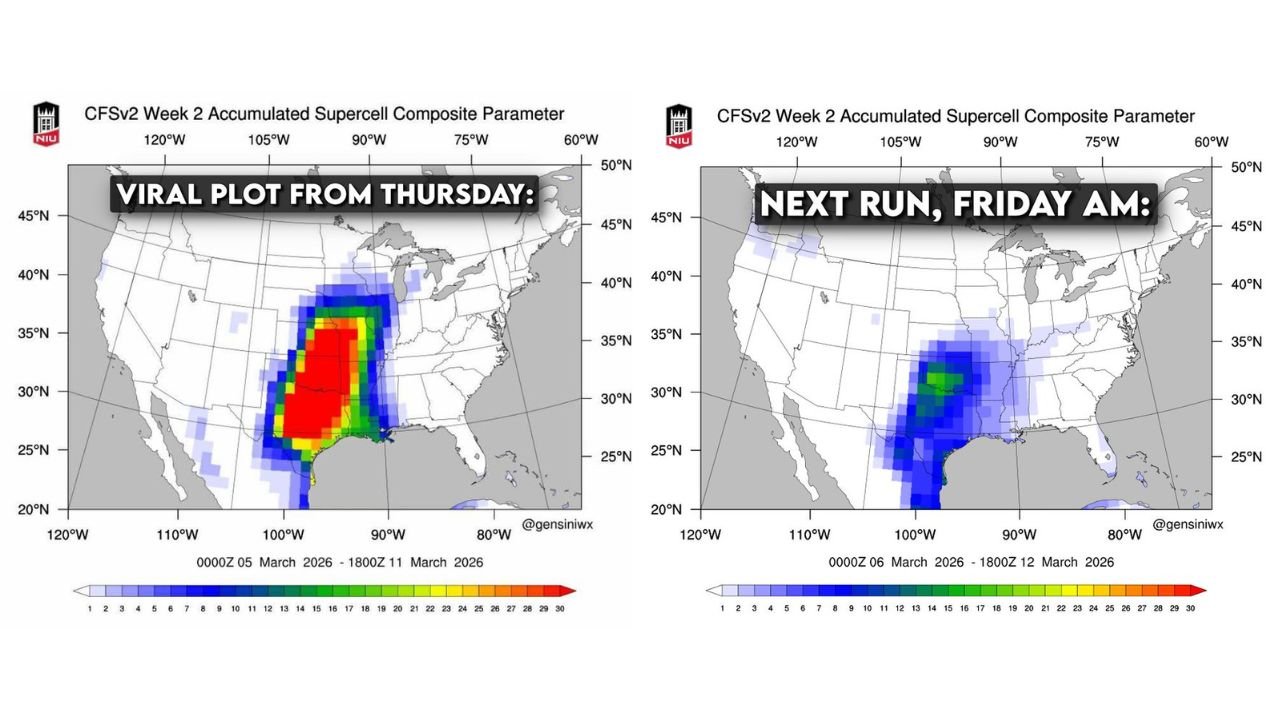
The earlier run of the CFSv2 Week 2 accumulated supercell composite parameter displayed a broad and intense signal from Texas northward through Oklahoma, Kansas, Missouri, and into parts of the Midwest for the March 5–11 timeframe.
The strongest values — shown in deep red — were concentrated across:
Central and North Texas
Oklahoma
Kansas
Missouri
The coverage extended northeast toward portions of the Ohio Valley, implying a potentially active and stormy stretch during the first half of March.
That map quickly circulated online, fueling discussion of a possible large-scale severe weather pattern.
Next Model Run Tones Down the Signal
However, the very next model run — issued Friday morning — tells a notably different story.
The updated guidance shows:
Much lower overall intensity values
A more confined severe signal centered mainly over Texas
Reduced northward extent into Oklahoma and the Midwest
The dramatic drop in widespread red shading illustrates just how sensitive long-range ensemble products can be from run to run.
This type of volatility is common in extended outlooks beyond 7–10 days.
Why Long-Range Severe Plots Can Be Misleading
The supercell composite parameter in long-range models blends multiple atmospheric ingredients, including instability, wind shear, and moisture. While useful for identifying potential pattern shifts, it is not a deterministic forecast.
At Week 2 range, small adjustments in:
Upper-level trough placement
Moisture return timing
Jet stream alignment
can significantly alter projected severe weather signals.
That’s why forecasters caution against treating these graphics as confirmed outbreak scenarios.
They are best used as pattern awareness tools — not event-specific forecasts.
Active Early-March Pattern Still Possible
Even with the toned-down signal, ensemble guidance continues to hint at a more active and unsettled start to March across the Southern Plains and parts of the central U.S.
This may include:
Multiple storm systems
Periods of rain and thunderstorms
At least some risk of stronger storms
However, the magnitude and geographic extent remain highly uncertain.
Confidence in specific severe weather outbreaks typically increases only within 3–5 days of an event, when higher-resolution guidance becomes available.
What This Means for North Carolina
For residents of Cabarrus County and the broader Carolinas, this evolving Plains pattern does not yet translate into a defined severe threat locally.
However, broader national pattern shifts can eventually influence weather across the Southeast, including:
Increased rain chances
Stronger frontal passages
Potential thunderstorm episodes later in March
At this time, there is no specific severe outlook for North Carolina tied to these long-range signals.
The key takeaway is caution: viral weather maps can generate attention, but extended-range guidance is prone to large swings.
As always, rely on updated short-range forecasts and official outlooks as we move closer to any potential events. We’ll continue monitoring pattern changes and provide verified updates at CabarrusWeekly.com as March approaches.