Texas, Kansas, Missouri, Tennessee and Ohio Valley Face Wetter Than Normal Summer as Strong El Nino Pattern Sets Up Active Jet Stream Through June, July and August
UNITED STATES — A strong El Nino event is shaping up to have significant consequences for summer rainfall patterns across the central and eastern United States. Historical data from the five strongest El Nino summers on record, using analog years of 1982, 1987, 1997, 2015 and 2023, shows a consistent pattern of above-normal precipitation running from the Southern Plains through the Ohio Valley during June, July and August.
What Strong El Nino Does to Summer Rainfall
During strong El Nino events, the jet stream becomes more active across the middle of the country, steering storm systems and moisture into the central United States more frequently than normal. This creates a corridor of enhanced rainfall and storm activity stretching from the Southern Plains northeastward through the Ohio Valley and into the Mid-Atlantic.
The effect is most pronounced during mid to late summer, while June tends to bring the driest anomalies for the Ohio Valley and Midwest regions before the pattern fully locks in. The current upcoming dry stretch across those areas is consistent with this typical June behavior during El Nino years.
The Precipitation Anomaly Map: Active Zone Identified
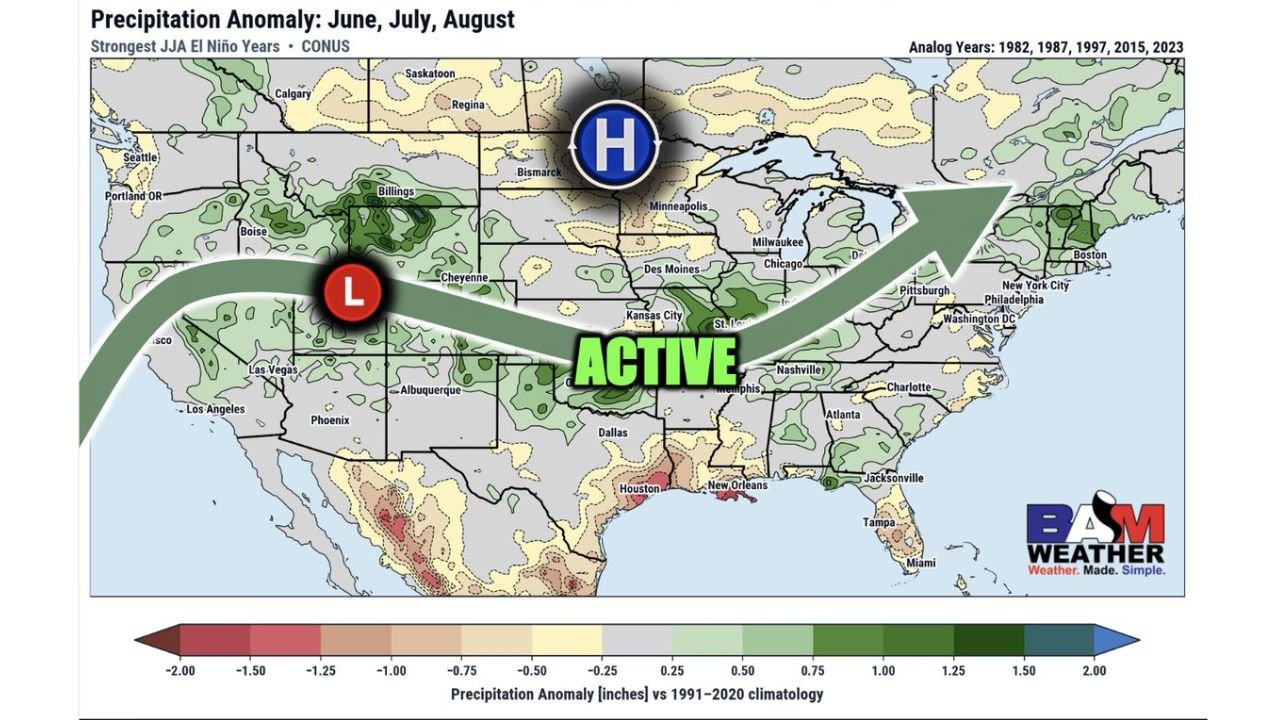
The precipitation anomaly composite map covering June through August across the five strongest El Nino analogs shows the following pattern clearly:
Above normal rainfall corridor:
- Kansas City and the central Plains sit in the heart of the active zone
- Missouri, Illinois and Indiana show positive anomalies of 0.50 to 1.00 inches above normal
- Tennessee, Kentucky and the Ohio Valley fall within the active corridor with anomalies of 0.50 to 1.25 inches above normal
- Pittsburgh, Philadelphia and Washington D.C. show modest positive anomalies on the eastern end
- New England including Boston and New York City show above-normal signals
Below normal or near normal zones:
- The Desert Southwest including Phoenix, Las Vegas and Albuquerque shows negative anomalies of -0.25 to -1.00 inches
- Parts of the Pacific Northwest and northern Rockies sit near to below normal
- South Texas and the Gulf Coast near Houston and New Orleans show near-neutral to slightly below-normal anomalies
The Atmospheric Setup Behind the Pattern
The map displays the classic El Nino summer configuration:
- A large High pressure (H) system anchored over central Canada and the northern Plains keeps the northern tier drier
- A Low pressure (L) feature positioned over the western United States helps funnel moisture northeastward
- The active jet stream corridor is shown as a large green arrow sweeping from the Southern Plains northeastward through the Ohio Valley and Mid-Atlantic, marking the primary storm track
What This Means for Summer 2026
For residents across Kansas, Missouri, Tennessee, Indiana, Ohio, Kentucky and the Mid-Atlantic, the El Nino analog signal suggests a more active and wetter than normal summer is possible through the July and August peak period. Storm frequency along the active jet stream corridor is expected to run above normal based on historical comparisons.
For the Desert Southwest and parts of the West, the same pattern historically brings drier and less active summer conditions.
Stay with CabarrusWeekly.com for continuing coverage as the El Nino pattern and its summer rainfall implications are tracked through the coming months.