Two Americas This Week: The Great Lakes Drowns in 500% of Normal Rainfall and Severe Weather While the Southeast Bakes in Record-Smashing Heat With Zero Rain in Sight From Charlotte to Atlanta to New Orleans
UNITED STATES — The weather pattern gripping the country over the next five days is one of the most striking and extreme contrasts meteorologists have seen in years. Two completely opposite weather regimes are locked in place simultaneously — one delivering up to 500% of normal rainfall and severe weather across the Great Lakes, and the other producing zero rain and major heat for the time of year across the Southeast. From Charlotte and Atlanta to New Orleans and Montgomery, the Southeast is running bone dry and dangerously hot. From Milwaukee and Lansing to Chicago and Detroit, the Great Lakes is being buried under historic rainfall totals. The dividing line between these two weather worlds is sharp, dramatic, and consequential.
The Rainfall Extremes — 500% of Normal in the Great Lakes, Zero in the Southeast
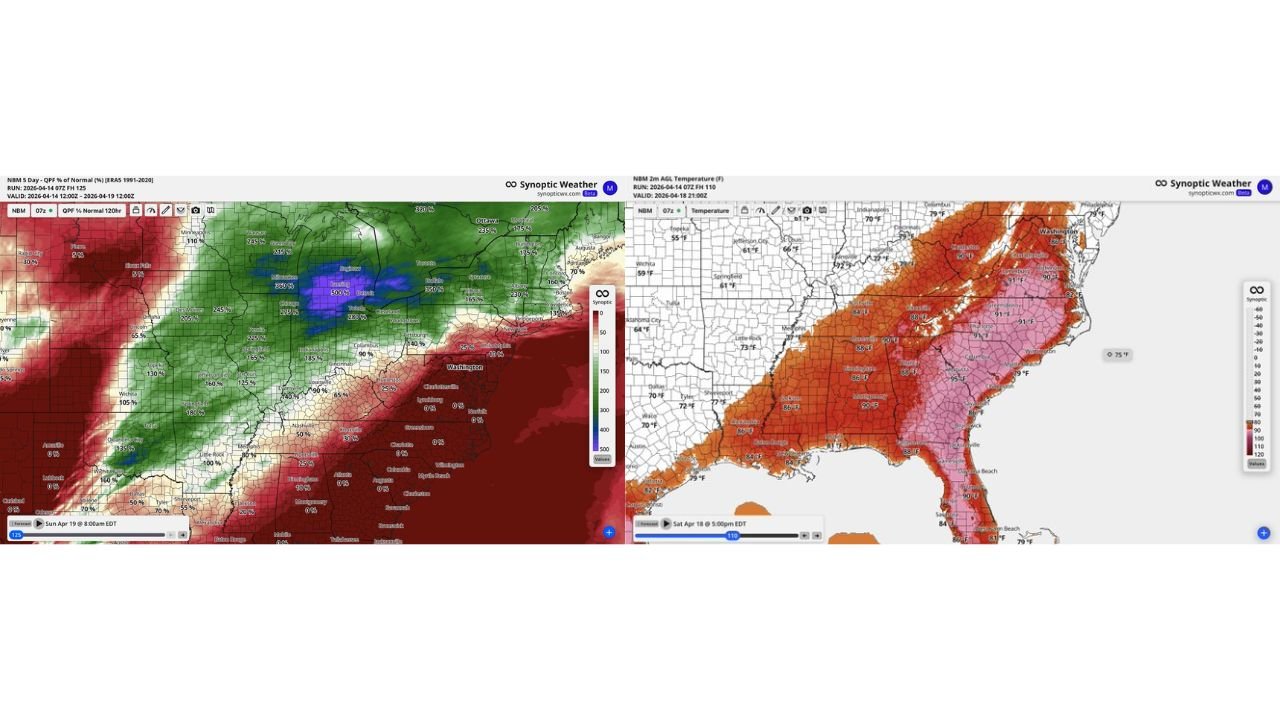
The NBM 5-Day QPF Percent of Normal map, run April 14, 2026 at 07Z and valid from April 14, 2026 at 12:00Z through April 19, 2026 at 12:00Z, captures the full and extraordinary scope of this split pattern across the eastern United States.
Great Lakes and Midwest — Drowning in Rain
| City | 5-Day QPF Percent of Normal |
|---|---|
| Lansing, Michigan | 500% |
| Milwaukee, Wisconsin | 360% |
| Buffalo, New York | 350% |
| Chicago, Illinois | 275% |
| Toledo, Ohio | 280% |
| Des Moines, Iowa | 245% |
| Green Bay, Wisconsin | 215% |
| Wausau, Wisconsin | 245% |
| Minneapolis, Minnesota | 110% |
| Peoria, Illinois | 225% |
| Springfield, Illinois | 165% |
| Indianapolis, Indiana | 185% |
| Columbus, Ohio | 90% |
| Cincinnati, Ohio | 90% |
| Ottawa, Ontario | 235% |
| Montreal, Quebec | 175% |
| Toronto, Ontario | 500% |
| Saginaw, Michigan | 500% |
| Syracuse, New York | 160% |
| Albany, New York | 160% |
| Ithaca, New York | 230% |
| Pittsburgh, Pennsylvania | 140% |
| Evansville, Indiana | 140% |
| Jefferson City, Missouri | 160% |
| St. Louis, Missouri | 125% |
| Topeka, Kansas | 130% |
| Wichita, Kansas | 105% |
| Springfield, Missouri | 180% |
| Little Rock, Arkansas | 100% |
| Memphis, Tennessee | 80% |
Lansing, Saginaw, and Toronto are sitting at 500% of normal rainfall for the five-day period — the highest values on the entire map and the top of the scale. Milwaukee at 360%, Buffalo at 350%, Chicago at 275%, and Toledo at 280% all represent extraordinary rainfall totals for a five-day window, and the severe weather component accompanying this rainfall means that much of this precipitation will arrive in intense, potentially flooding bursts rather than gentle steady rain.
The Southeast — Zero Rain, Extreme Heat
The contrast on the southern half of the map is total and complete. Across the Southeast, the five-day rainfall percentage drops to zero across a massive swath of the region.
| City | 5-Day QPF Percent of Normal |
|---|---|
| Charlotte, North Carolina | 0% |
| Greensboro, North Carolina | 0% |
| Raleigh, North Carolina | 0% |
| Wilmington, North Carolina | 0% |
| Myrtle Beach, South Carolina | 0% |
| Columbia, South Carolina | 0% |
| Atlanta, Georgia | 0% |
| Birmingham, Alabama | 10% |
| Montgomery, Alabama | 0% |
| Huntsville, Alabama | 25% |
| Knoxville, Tennessee | 30% |
| Nashville, Tennessee | 50% |
| New Orleans, Louisiana | 0% |
| Mobile, Alabama | 0% |
| Tallahassee, Florida | 0% |
| Jacksonville, Florida | 0% |
| Savannah, Georgia | 0% |
| Charleston, South Carolina | 25% |
| Washington D.C. | 0% |
| Norfolk, Virginia | 0% |
| Lynchburg, Virginia | 0% |
| Philadelphia, Pennsylvania | 10% |
| New York City area | 25% |
Charlotte, Atlanta, New Orleans, Montgomery, Tallahassee, Jacksonville, Savannah, Columbia, Wilmington, Myrtle Beach, Washington D.C., and Norfolk all sit at zero percent of normal rainfall over the full five-day period. This is a complete rainfall shutout across the entire Southeast — not a reduction, not below normal, but zero.
The Heat — Major for the Time of Year Across the Southeast
The NBM temperature map valid Saturday April 18, 2026 at 5:00 PM EDT and the 5-day temperature anomaly map valid April 14 through April 19, 2026 tell the other half of the Southeast story — and it is a record-challenging heat event unfolding across the region simultaneously with the complete rainfall absence.
Saturday April 18 Afternoon Temperatures Across the Southeast
| City | Saturday April 18 — 5 PM Temperature |
|---|---|
| Fayetteville, North Carolina | 95°F |
| Raleigh, North Carolina | 91°F |
| Charlotte, North Carolina | 90°F |
| Columbia, South Carolina | 95°F |
| Charleston, South Carolina | 91°F |
| Atlanta, Georgia | 88°F |
| Birmingham, Alabama | 90°F |
| Montgomery, Alabama | 95°F |
| Huntsville, Alabama | 88°F |
| Washington D.C. | 90°F |
| Charlottesville, Virginia | 91°F |
| Wilmington, North Carolina | 84°F |
| Myrtle Beach, South Carolina | 86°F |
| Dallas, Texas | 86°F |
| Little Rock, Arkansas | 73°F |
| Memphis, Tennessee | 79°F |
| Wichita, Kansas | 59°F |
| Springfield, Missouri | 61°F |
Fayetteville, Columbia, and Montgomery are hitting 95 degrees on Saturday afternoon. Charlotte reaches 90. Raleigh hits 91. Washington D.C. touches 90 and Charlottesville reaches 91 — all in mid-April, all with zero rainfall in the five-day window, all on top of drought conditions that are already deeply entrenched across the region.
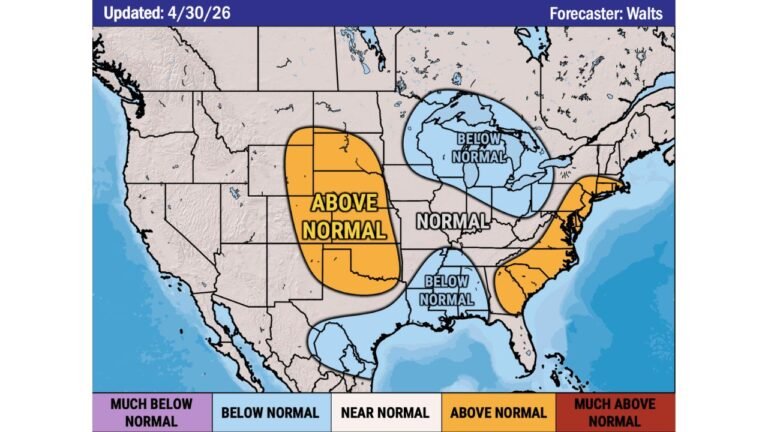
Temperature Anomalies — How Far Above Normal Is This?
The 5-day temperature anomaly map, valid April 14 through April 19, 2026, shows the full scope of how far above normal temperatures are running across the eastern United States during this period. The entire map is dominated by deep red and maroon shading.
| City | 5-Day Temperature Anomaly |
|---|---|
| Washington D.C. | +16°F above normal |
| Pittsburgh | +20°F above normal |
| Columbus, Ohio | +16°F above normal |
| Indianapolis | +16°F above normal |
| Charlotte, NC | +16°F above normal |
| Atlanta, Georgia | +13°F above normal |
| Birmingham, Alabama | +11°F above normal |
| Nashville, Tennessee | +13°F above normal |
| Memphis, Tennessee | +14°F above normal |
| Springfield, Missouri | +13°F above normal |
| Topeka, Kansas | +9°F above normal |
| Wichita, Kansas | +9°F above normal |
| Oklahoma City | +5°F above normal |
| Sioux Falls | +5°F above normal |
| Rapid City | +4°F above normal |
Pittsburgh running 20 degrees above normal. Washington D.C., Charlotte, Columbus, and Indianapolis all running 16 degrees above normal. Atlanta, Nashville, and Memphis sitting 11 to 14 degrees above what is typical for mid-April. This is not a modest warm spell — this is major heat for the time of year across one of the most densely populated corridors in the country, arriving with zero rainfall and on top of existing drought across much of the Southeast.
The Dividing Line — Where the Two Patterns Meet
The contrast between the soaking Great Lakes and the parched, overheated Southeast is drawn along a sharp boundary running roughly from the Ohio Valley through the mid-Atlantic. Cities near that boundary experience the transition:
| City | Rainfall % of Normal | Temperature Anomaly |
|---|---|---|
| Louisville, Kentucky | 65% | +16°F above normal |
| Cincinnati, Ohio | 90% | +16°F above normal |
| Columbus, Ohio | 90% | +16°F above normal |
| Nashville, Tennessee | 50% | +13°F above normal |
| Evansville, Indiana | 140% | +16°F above normal |
| Pittsburgh, Pennsylvania | 140% | +20°F above normal |
Even the transition zone cities are running dramatically above normal in temperature while still seeing only a fraction of the rainfall totals occurring in the Great Lakes core to their north.
What This Means for Each Region
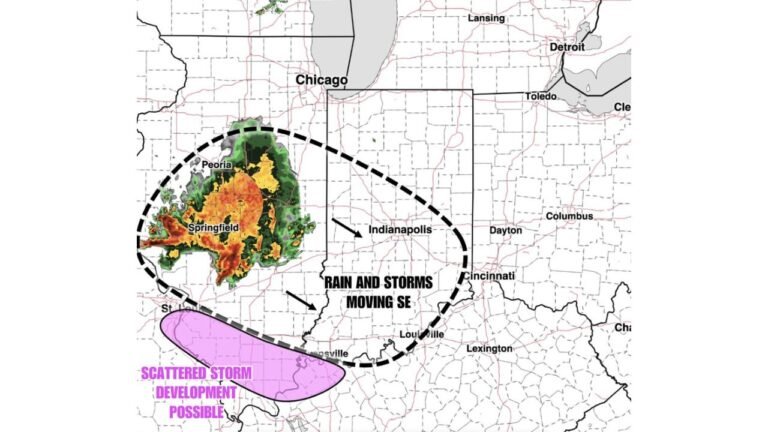
For the Great Lakes — Milwaukee, Lansing, Chicago, Toledo, Buffalo, Detroit: The combination of 500%, 360%, and 275% of normal rainfall with an active severe weather pattern means flooding is the primary concern for the next five days. Repeated rounds of heavy rain — some accompanying severe thunderstorms — will stack rainfall totals to levels that urban drainage systems, rivers, and streams cannot handle. Flood watches and warnings should be expected across the Great Lakes corridor through April 19.
For the Southeast — Charlotte, Atlanta, Columbia, Fayetteville, Montgomery, New Orleans: Zero rainfall over five days combined with temperatures running 11 to 16 degrees above normal on top of already severe drought conditions is a genuinely dangerous combination. Drought will deepen rapidly. Wildfire risk will climb. Agricultural stress will intensify. Heat-related health risks will increase as April temperatures approach and exceed 95 degrees across the region without any relief in sight from rainfall.
The Five-Day Pattern at a Glance
| Factor | Great Lakes | Southeast |
|---|---|---|
| 5-Day rainfall vs normal | Up to 500% of normal | Zero percent |
| Temperature anomaly | 9 to 20°F above normal | 11 to 16°F above normal |
| Saturday April 18 peak heat | Cooling behind cold front | 90 to 95°F — Fayetteville, Columbia, Montgomery |
| Primary concern | Flooding and severe weather | Drought deepening, wildfire risk, record heat |
| Cities most impacted — wet | Lansing, Milwaukee, Chicago, Buffalo, Toledo | — |
| Cities most impacted — dry and hot | — | Charlotte, Atlanta, Columbia, Fayetteville, Montgomery, New Orleans |
Two Extremes, One Country, Five Days
The next five days will deliver one of the most dramatic weather contrasts the eastern United States has experienced in recent memory. Lansing and Milwaukee are drowning under 500% and 360% of normal rainfall as severe weather fires repeatedly across the Great Lakes corridor. Charlotte, Atlanta, Columbia, Montgomery, and New Orleans are getting nothing — zero rain — while temperatures hit 90 to 95 degrees and drought conditions spiral deeper toward crisis levels.
This is a tale of two weather patterns playing out simultaneously across the same country over the same five-day window — and both ends of that contrast carry serious consequences for the millions of people living within them.
Stay with CabarrusWeekly.com for daily updates on the Great Lakes flooding threat, Southeast drought and heat coverage, and the full five-day forecast for both extreme weather regimes through April 19.